What Lululemon Probably Isn’t Measuring (But Should Be If They Want to Retain Their Customers)
by Stacey Barr |As a self-confessed Lululemon addict, I’ve been following their website and blogs for a couple of years now. My interest is in their product (for my running and yoga wardrobe) but also in their business model. I noticed a few lead indicators of their recent public relations catastrophe that apparently they didn’t.
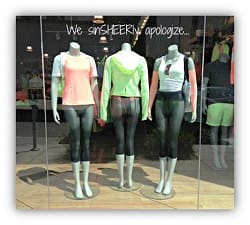
Lululemon recently responded with wit to the bad PR they received for see-through athletic pants: “We sinSHEERly apologize” featured in one of their store windows, with exaggerated examples of sheer pants.
This followed with a big product recall on all pants that customers deemed too sheer. And the fired the Executive in charge of the debacle.
And only a couple of weeks later, another product recall was announced, on new pants released AFTER the first recall! How can Lululemon have let this happen? Didn’t they learn?
I wonder if either of these PR nightmares would have happened if Lululemon measured and used a few very simple lead indicators.
Lead Indicator #1: Number Online Reviews by Star Rating
Anecdotally I’ve noticed stirrings of dissatisfaction in the product reviews on Lululemon’s websites. More and more of the reviews are complaining about the same things. Sheerness. Poor fit. Thinner and cheaper feeling fabrics. And the star ratings are lower, too.
Tracking the average star ratings, week by week in a Smart Chart, would quickly pick up shifts in product satisfaction before it got out of hand. Tracking this overall, and also for their flagship products (e.g. Wunder Unders) and their newer, edgy products, would be easy. The data is right there.
Lead Indicator #2: % Product Purchases Returned
Customers are always welcomed by Lululemon to return products that don’t fit or perform as promised. You don’t need to wait for a product recall to return a product.
Product recalls are the lag effect of customer dissatisfaction. Because Lululemon are bringing out new products every week, as limited editions, they have plenty of opportunity to learn quickly about potential problems by tracking something like the percentage of products that are returned (either online sales or store sales).
If they saw a signal in the Smart Chart showing an increase, and did some very simple analytics to find the primary reasons for returns, Lululemon should be able to figure out which products they need to take back to the drawing board BEFORE a series of product recalls is required.
Lead Indicator #3: % Online Customers Posting Product Reviews
Lululemon has enjoyed an almost cult-like following. With this unusually high amount of customer engagement, their websites are jam-packed with detailed and honest customer reviews for all their products.
But as this engagement is chipped away by bad PR and poor quality and service, customers are less likely to give their time and effort to feedback. Particularly if, like me, they are seeing Lululemon do little in response to that feedback.
So another potentially useful thing for Lululemon to measure is the percentage of online customers who post product reviews. A signal of decline in this measure would be a proxy indicator of customer engagement waning.
Can Lululemon win back its once-loyal but now-ticked-off addicts?
Of course they can. But they’d need to show a lot more commitment to listening to their customers’ generous feedback. And instead of just firing someone, they need to fix the core business processes that impact the quality of the fit and function of their products. When Lululemon measures the right results that drive customer loyalty, and quickly acts on the signals in those measures, we’ll see them return to their former glory.
JOIN THE DISCUSSION:
In your own industry, what are the drivers and possible lead indicators of customer loyalty? Share your suggestions on the blog.
Join Measure Up
Sign up for the Measure Up newsletter and get free access to the "10 Secrets to KPI Success" online course and e-book.

Upcoming KPI Training
All our PuMP training options have moved to PuMP Academy.


Connect with Stacey
Haven’t found what you’re looking for? Want more information? Fill out the form below and I’ll get in touch with you as soon as possible.
167 Eagle Street,
Brisbane Qld 4000,
Australia
ACN: 129953635
Director: Stacey Barr