How Focusing On Variation Frees Up Your Capacity
by Stacey Barr |Work stress, projects behind schedule, and low productivity are all symptoms of an underlying problem with workload variability. You’ll feel it as some months you can’t get the important things even started, and other months you’re pushing productivity past the redline. The solution lies in measuring the variation in workload, and not just the amount of it.
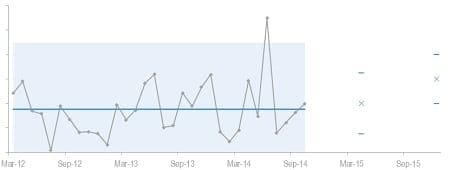
Below is an example of a performance measure that has more variability than I want. It’s a measure of the amount of program work I deliver on a monthly basis, displayed in an XmR chart. See how much variability there is?

When there’s too much variability, you get bottlenecks. When you get bottlenecks, you lose capacity.
Of course none of us can run our lives like clockwork. It would be ridiculous to expect an identical workload each month. But I can expect to reduce the variation from where it currently is, to something more enjoyable and predictable.
In 2015 I’ll focus on smoothing this variation out, and it will spin off a few benefits like lowering my stress, improving workload predictability, and increasing my availability to deliver programs. That’s because a phenomenon happens when you reduce variation: the performance level improves as a natural consequence.
Over on the right of the above chart you can see my targets for reducing the variability over 2015. It’s just a question of improving my marketing and scheduling processes. The targets might look modest, but I know how much process redesign it will take to reach them. And when I do, I’ll be thrilled.
You can do this too. There will be plenty of opportunities in your organisation to reduce the variability of performance results that can improve your capacity. Here are a few ideas:
Capacity-Building Measure #1: Time Spent on Priorities
Time Spent on Priorities is the percentage of your (or your team’s) work hours that are spent on actually delivering your priority outcomes. Yes, you’ll need to start keeping track of where your time goes each day!
If you’re not spending most of your time on delivering the results that are core to your role, then you definitely have a capacity problem. A colleague of PuMP Consultant Mark Hocknell started measuring this for an applications processing team, and found that they were spending only 30% of their time on their core business of processing applications. Not right.
Capacity-Building Measure #2: Average Task Cycle Time
Average Task Cycle Time is the average time it takes to complete a specific task type. Group tasks into similar categories based on how long they should take, and then see how much actual time varies relative to expected time.
If you don’t know how much time it takes to get things done, it’s almost a law of the universe that it is, in fact, taking much longer than it needs to. Find the scope-creep, tangents, distractions, rework, and interrupted workflow that all have an insidious way of bloating tasks.
Capacity-Building Measure #3: Demand-Deliver Lag Time
Demand-Delivery Lag Time is the average time from when your customers request you for a service to when you deliver that service. Whether we call them customers or not, we all have people who consume the outputs of our work, and in their own ways create demand for it.
When demand is sporadic and unmanaged, it wreaks havoc with our workload. But demand can be managed so it can become more predictable and stable over time. The answer lies in how proactive you can be in establishing relationships with your customers, understanding their needs, and designing your business processes to respond with more ease and speed.
TAKE ACTION:
Start monitoring your chosen measures using XmR charts, and pay attention to the amount of natural variability in those measures. Then set your sights on reducing that variability by streamlining and simplifying and standardising the underlying business processes.
Connect with Stacey
Haven’t found what you’re looking for? Want more information? Fill out the form below and I’ll get in touch with you as soon as possible.
167 Eagle Street,
Brisbane Qld 4000,
Australia
ACN: 129953635
Director: Stacey Barr


