How to Find Signals in Your Seasonal KPIs
November 20, 2012 by Stacey Barr | Leave a Comment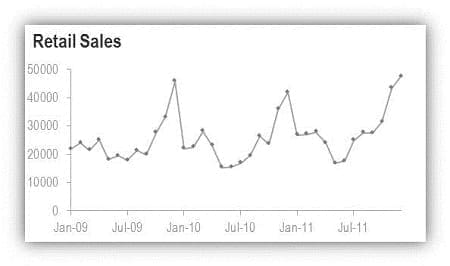
One of the trickiest KPIs to analyse, interpret and use are those that have a seasonal or cyclical pattern. Can you make these KPIs reveal their insights about how to improve performance, without getting drowned out in the seasonal variation? Yes you can!
Filed Under:
Analytics and Data Analysis, Interpreting Performance Results
Why Statistical Thinking is ESSENTIAL to Great KPIs
October 30, 2012 by Stacey Barr | Leave a Comment
Statistical thinking is not so much about having knowledge of and being able to apply statistical techniques. It’s NOT about knowing how to perform a regression analysis or knowing the formula for putting a trend line through a time series.
Filed Under:
Analytics and Data Analysis, Interpreting Performance Results
QUESTION: How do you measure seemingly immeasurable work?
July 24, 2012 by Stacey Barr | Leave a Comment
Andy M. asks: "Many of my colleagues work in what is often called a "considerative" area. They don't produce things. They assess evidence, form judgements, give opinions. They say the work is too complicated to be measured. I keep saying "If you can't measure it how do you know you're providing quality?" How can I convince them?"
Filed Under:
Analytics and Data Analysis, Meaningful Performance Measures
Three Questions to Design Your KPI Reports
November 1, 2011 by Stacey Barr | Leave a Comment
Unless your performance reports are focused on answering three critical questions, they're likely to bore you sleep, lead you astray, or confuse the begeesus out of you. (more…)
Three Things You Need On Every KPI Graph
November 16, 2010 by Stacey Barr | Leave a Comment
Do you have these 3 essential things on your KPI graphs in your dashboard? If not, you're misinterpreting your performance measure signals. (more…)
Five Steps To Simple and Actionable Customer Surveys
November 2, 2010 by Stacey Barr | Leave a Comment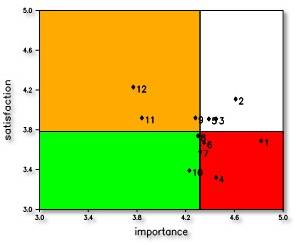
KPI Data Integrity Depends on 5 Rs
June 15, 2010 by Stacey Barr | Leave a Comment
You depend on the quality of data and information to provide a stable foundation for your decision making. Decision making often involves responding to something, so you need your data to validly describe what you are responding to so that you choose the right responses. Whether your data is quantitative (based on numbers) or qualitative (based on perceptions), it's integrity depends on 5 wi...
What’s So Special About Lead Indicators?
October 19, 2009 by Stacey Barr | Leave a Comment
Most performance measures or KPIs tell you what happened. But if we're really going to manage company or organisational performance, we need to know something about what's going to happen. And that's what lead indicators do. They are a special breed of performance measure or KPI because they have predictive power.
DOWNLOAD: Do your performance reports “stack up”?
September 14, 2009 by Stacey Barr | Leave a Comment
It's an emotional thing, performance reporting and dashboarding. Executives give up the precious little time they have for their families to instead paw through piles of strategic reports often more than an inch thick (or several drilldowns deep). Or they leave the pile of reports on their desk, or give their performance dashboard a quick glance, but then make decisions from their guts inst...
WOW! What a Cool Performance Report!
January 19, 2009 by Stacey Barr | Leave a Comment
How fast you can get from "We need some measures," to "Wow, what a cool performance report!", the better. (more…)
Join Measure Up
Sign up for the Measure Up newsletter and get free access to the "10 Secrets to KPI Success" online course and e-book.

Upcoming KPI Training
All our PuMP training options have moved to PuMP Academy.


Connect with Stacey
Haven’t found what you’re looking for? Want more information? Fill out the form below and I’ll get in touch with you as soon as possible.
167 Eagle Street,
Brisbane Qld 4000,
Australia
ACN: 129953635
Director: Stacey Barr