An Insight from the COVID-19 Metric – Growth Factor
by Stacey BarrThe COVID-19 Growth Factor metric is an insightful model for measuring results that move from chaos to stability, then to improvement.

One question I’m asked often is how to measure performance in start-up businesses:
“When to integrate and devote KPI efforts into a pending start-up: day 1, 100, 1,000?” – Mike in the US
“How do I implement performance measurement as a start-up?” – Charles in Africa
“How to apply kpi for small and new start-up businesses” – Alex in Australia
“How do I define KPIs for a startup digital product idea?” Derick in France
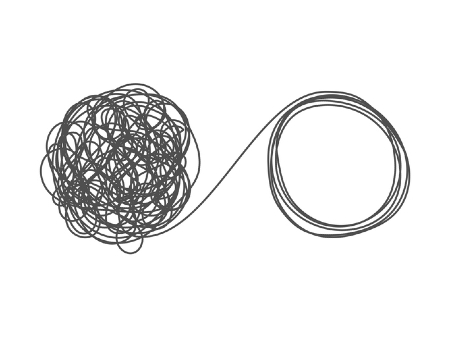
A big part of measuring performance in start-ups is understanding that we’re not starting with a stable and predictable system. Many new ventures start out in chaos, move into stability, and only then respond to improvement. They behave a bit like contagions.
And, as unfortunate as it is, COVID-19 gives us an opportunity to understand contagion behaviour, first hand. But it also offers a clue for how we can bring our organisations out on the other side.
Growth Factor is a template metric for start-up growth.
Start-up businesses (and possibly existing businesses recovering or redesigning themselves in COVID-19’s economic wake) want growth as one of their results. Usually this means growth of market awareness, new customers, revenue and profit.
Even though we want the opposite for COVID-19, decline instead of growth, it makes for a good example of interpreting measures of growth, from a zero baseline.
What is Growth Factor?
One of the COVID-19 results I’m personally most interested in is the rate at which it spreads out into the human population. Is the rate of spread predictable? How quickly is it spreading? Is there any sign that it’s slowing down?
And, one of the published COVID-19 metrics I follow every day monitors this result:
Growth Factor = today’s new cases of COVID-19 expressed as a proportion of yesterday’s new cases of COVID-19, calculated daily
Interpreting the Growth Factor of COVID-19
Here’s the time series of the worldwide Growth Factor for COVID-19:
There are three stages that need to be interpreted in this measure.
Stage 1 is chaos.
Chaos is a pattern of variability that is unpredictable. There is no pattern that holds consistently over time.
We can see the chaotic variation over January and most of February, as the virus breaks out of China and starts spreading, and as humans start to get a handle on detecting and reporting it.
Stage 2 is stability.
Stability is when the pattern of variability becomes predictable. Some kind of upper and lower limit establishes and holds over time.
In the COVID-19 Growth Factor, we can see how the chaos settles down, into a still-variable but now-predictable pattern toward the end of February. That’s the point in this measure where my interest begins: the shift from chaotic to stable.
Stage 3 is improvement.
Improvement is when we actively influence or change the pattern of variability. Through our actions, we can have a desired effect that ‘sticks’.
What I’m looking for is evidence that the COVID-19 Growth Factor is slowing down. It means that it’s spreading at a slower rate, and it might be evidence that our social distancing, quarantining and other actions are working, to get it under control.
When will COVID-19 stop growing?
To clearly see any signals that evidence improvement, I put the values of the worldwide Growth Factor into an XmR chart (below is just the X-chart, without the mR chart):
[There was no point including the data over the chaotic period, which is why the upper and lower natural process limits and the central line don’t start until late February.]
This is a good example of a measure where the likely changes will be small, and our eyes could miss them. The XmR chart won’t miss them, though. But so far, there isn’t a signal of change in Growth Factor; it’s continuing to average around 1.2 (the current central line).
You might agree there is a subtle suggestion of a downward movement over the end of March. It’s not a statistically valid signal yet, but I’ll keep watching, because if Growth Factor signals a drop below that central line, that’s good news.
[If you want to play with the XmR approach to tracking COVID-19’s Growth Factor, updating the data for yourself over the days ahead, you can download my spreadsheet here and learn how XmR charts work here.]
Measuring growth through its 3 stages might be relevant for more than just start-ups.
Our global community will do whatever it takes to turn the Growth Factor of COVID-19 downwards, and return it to zero. But after that happens, businesses will want the growth factor of their customers, sales, revenue and profit to turn upwards again.
We’ll need some patience and perseverance, because in the new world and new way of working, growth might be more like it is for start-ups and contagions. We might need to move business performance through those three stages:
- Chaotic performance in the early days, until we find our feet in changed business and economic landscape
- Stability emerging, once we find our feet and set up new systems and processes to fit with the new ‘normal’
- Improvement, through new change initiatives and the most efficient strategy execution we can muster
Which business results do you think your organisation will want to grow again, as a priority, on the other side of COVID-19?
Start-up performance, like any contagion, will likely grow through chaos first, then into stability, before it can be improved.
[tweet this]
Connect with Stacey
Haven’t found what you’re looking for? Want more information? Fill out the form below and I’ll get in touch with you as soon as possible.
167 Eagle Street,
Brisbane Qld 4000,
Australia
ACN: 129953635
Director: Stacey Barr


